I used Google Forms to create the following self-assessment for students in a pre-calculus class.
Students would complete this form at the end of a semester/quarter. The intent of this activity is twofold:
In order to receive some feedback about my teaching performance, I ask students to tell me one thing that they thought I did well and one thing they thought I could do better to help them be successful in class. I can use the student feedback to help myself improve as a teacher. Initially, I had a field for students to enter their names, but I chose to delete this question so students could answer more candidly. I also devoted one question to finding out whether or not students think the material they learned will be useful in their lives. I always try to make math lessons applicable to the real world, and this question tells me how well I did this.
Students are given an opportunity to reflect on their own performance throughout the semester. They might consider if they need to stay more organized, put forth more effort, or ask more questions. The intent is that students reflect on their performance and then improve in following semesters.
Since I am already pretty familiar with many of Google’s most used features, I thought I would try and create something that I have wanted to set up for my class in the future – a blog! Unfortunately, Google hasn’t progressed that far yet, and they don’t have an option for a class blog that can be built into Google Classroom. I decided to play around with Google Sites, and I created a relatively simple class website that I could share with parents and students to give them access to what is going on in school, and to get easier access to a calendar where students can see what is going to be due soon. I also envision having a place where students can download copies of homework assignments so that if they lose them, they can print them at home or submit them to me online. I feel that this website could contain many features, such as a place for students to post or to comment on things, but I did not see anywhere that that could be an option.
The other thing that I found that I want my students to install on their Chromebooks is this app called “Google Cast for Education” which allows students to cast whatever is on their screen to my computer so that I can display it on the Smartboard which is connected to my computer through a wireless AppleTV connection. Often students will be researching something, or will want to display something on their screen to the class, and rather than sharing it with me or having me find it on my computer, it would be useful for students to have this installed on their Chromebooks.
I see a future where there are no more desks or pens and paper in a classroom, and all there is are places for students to sit and work on their Chromebooks, and all the learning and assessment is done on their computers. I see furniture that is flexible and easy to move to make space for collaboration between students and the teacher, and I think Google is the leader in getting us towards this future.
The other thing that I found super cool while exploring some of the “Hipster Google” apps was the Google Trends app. It allows you to see in real-time what people all over the world are googling, and what popular Google searches are happening in countries all over the world. I’m not sure how it would be beneficial in an Educational context, I just thought it was a cool feature, and a cool way to see what people are interested in in this specific moment in time. I also set it as my screensaver.
How much did that title trigger you? I’m not a shill, I swear!
If you understood any of those words, good on you! If you didn’t, chances are you stopped reading and went to Google to look up the definition to try and understand what I was trying to say.
These slang words are everywhere. Even the word “slang” is slang for shortened language. You hear it all the time: on the radio, in your home, from your friends, if you’re a teacher definitely in your classrooms.
Let me tell you a thing, man. If you want to do a rad math lesson that not only introduces trends but gets your kids engaged because it’ll relate to them in the best way possible: they speak that language. Not only will they be super excited to be speaking their hipster tongue, you’ll also (hopefully) get them super excited about speaking your language: math.
Here’s a really cool site that you can use for the lesson:
It’s a card on Google Trends and it is amazing. This particular card shows you the top rising definitions of last year (2016) and how it is ranked based on how often they were searched in Google.
Click on the image to go straight to the card. You can scroll down to see different representations of the same data Google has been collecting over the past couple of years; even the top rising definitions of words from previous years.
But how would I use this in a lesson? And why would I ever encourage my students to use language that I don’t understand in the classroom?
Let’s face it. Students are more and more distracted every day by the various forms of technology they are exposed to; I am not an exception to this because just now I checked my phone to see if I had a message from anyone….
Why not use this distracting quality of technology, and the students’ overuse of slang, and at least attempt to make it educational? They’re going to do it on their own at home anyway; might as well make it relevant to the subject matter you’re teaching.
With this Google Trends card, you can prompt students to think critically about:
How these words got popular
Why some words might have died out
Predictions about how much longer they’ll stay popular based on their own personal experiences/uses of the words as well as the data on the site.
Plus, the site is really interactive, so even kids that aren’t usually engaged will want to play with the cool colorful things they see on the site, or explore any of the other Google Trends cards that are available.
Trending word definitions are not the only things you can look up on Google Trends. There are sections about everything and anything that somebody has put in their search bar and pressed enter.
Here’s what their card on Global Warming/Climate Change looks like (click on the picture to go to the website):
You can see how each major city/country ranks regarding the frequency of searching those words on that list on the left. It’s incredible. Google Trends is one of many leaps Google has taken to visualize data to make it easier for educators to present and analyze information they have been collecting. You would also be doing your part as a citizen by spreading awareness and making sure your students, or anyone who would listen to your lesson, are able to make well-informed decisions.
They will also avoid sounding like know-it-alls who have no concrete information to back their claims up. They could just pull out the notes from your lesson and the activity they did and present the same information, thus increasing the number of people who are aware and are able to make informed decisions.
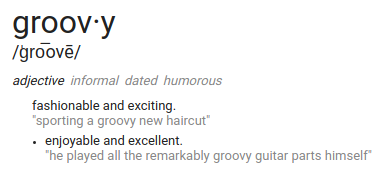
What is groovier than using the word groovy? Answer: Being able to use tech tools to realize the relative usage of the word “groovy” throughout time and thus conclude that perhaps your smooth colloquialisms might not be so smooth or hip after all. Good news: There is an abundance of alternative adjectives; maybe with some more research you can identify your optimal adjective of choice.
Which brings us to the reason for thinking about word optimization after all – as a slightly more creative method of learning about rates of change, critical points, and optimization in a Calculus class. I’ve designed a lesson that involves students researching word usage to apply the information they will have learned just prior.
After this lesson, students will be able to:
Identify on which intervals a function is increasing or decreasing.
Identify whether slope over an interval is increasing or decreasing at an increasing rate (accelerating) or a decreasing rate (decelerating).
Label critical points and make conjectures about the cause of these points.
Identify local and global maxima and minima (ie. extrema).
Apply the Extreme Values Theorem to a graph and explain why, when the conditions of the theorem are satisfied, it assures that the given point is a global maximum or minimum.
Basically, students will use Google Ngram to look up word usage over time and select a few of the resulting graphs to analyze to practice applying what they will have just learned about the topic in a fun way.
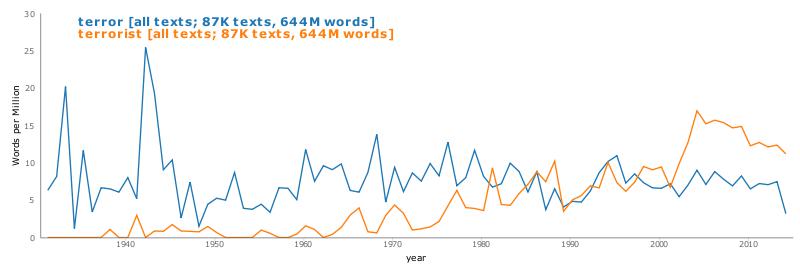
For example, students might look up the word “groovy” – yes, I said it again… I’m just helping the search rankings for this poor antiquated word to go up a tiny percentage (I should know better than this) – and the following result will appear:
I particularly like this example because of its graphical qualities – it has a clear increase and decrease and is not very choppy.
Once students have found a “nice” graph, they will then identify a given list of qualities such as maxima, minima, extrema, signs of the slope (derivative) within intervals, and signs of the derivative of the derivative (acceleration) within intervals.
Next, in order to connect this activity to real life, I will ask students to make predictions about why a word gained or lost popularity over a given time period. To make an informed prediction, they might research relevant events that occurred in the given time period and how this might then have affected common word usage. In essence, I want them to realize that graphs tell stories and that math is a tool that we can also use to communicate, illustrate, and explain these stories.
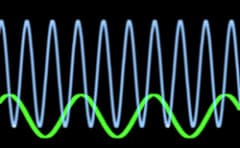
One data visualization tool that would be helpful for students to use in a math classroom is Desmos graphing calculator. I could use Desmos in a lesson about graphing sinusoidal functions. I might begin the lesson by instructing my students to log on to Desmos and simply modify the equation in any way that they wish. I would instruct them write down what they observe as they do so. After they have had some time to explore, I might provide a worksheet for some more guided practice. The worksheet might ask them to do things such as add a constant to the equation and observe what happens. Students should notice that the graph is moved up by whatever constant they added, like in the image below.
The worksheet might also ask them to multiply the sine curve by a constant. When doing so, students should notice that the sine curve gets taller.
The use of Desmos graphing calculator allows students to quickly and easily see how modifying the equation changes the graph. Once students have any idea of different modifications change the graph, I would introduce formal vocabulary for the modifications. For example, adding a constant creates a vertical shift and multiplying by a constant changes the amplitude of the sine curve.
In fifth grade, the social studies standards generally cover the founding of North America, the lead up to the Revolutionary War, and the war itself. In some exploring of these data visualizations websites, I think I would want to use the US News Map website to help students visualize what attitudes different populations of people had regarding the Revolutionary War and the separation of the American colonies from Great Britain. This website would be a great way for students to see where exactly different groups of people lived based on their political opinions expressed in newspapers of the day. They can search for key words such as “Loyalist” and “Patriot” and this website will show them where the terms were used most heavily in newspapers in different regions. I think this would be a great resource to just let my kids explore and discover different patterns for themselves instead of me telling them something like: “Most Loyalists lived in New England…” With this, they can discover that for themselves, as well as get the opportunity to read some primary source documents from the time period.
Luckily in my student teaching placement, we have a lot of access to technology, but students are not able to take that technology home with them that would be necessary for a truly flipped approach to be successful. The lesson I would have students do is this Google Slides presentation that is also interactive! The best part of this Slides presentation is that it is interactive, and has places for students to type and move arrows around on the screen built into the presentation, making it much more engaging than a traditional PowerPoint presentation. You would somehow have to share this presentation with students, with Google Classroom or a class blog of some kind being the best option for sharing a Google Slides presentation.
This lesson has five stages: Engagement, Exploration, Explanation, Elaboration, and Evaluation. The first part of the lesson, Engagement, has students watch 2 videos that that explains how energy moves in a food chain. This is a good way to introduce new material to students in this flipped format because they can go back and re-watch any parts of the video that they missed, or did not initially understand. Following the video, there is a place for students to record any words that students did not know when they watched the videos. These are both good videos for introducing a new topic to students, as they put the academic vocabulary that goes along with Ecosystems and food chains into very kid-friendly language and the videos are interesting and engaging for students to watch on their own.
The next three parts of the activity, Exploration, Explanation, and Elaboration all have students doing a variety of different activities that have to do with Food Chains. The one that I like the best that I would want to use as an evaluative tool instead of the test at the end of the presentation is the choice board that comes with the Elaboration section of the activity.
This has students show me in a way that works best for them what they learned about Food Chains during this lesson that they completed on their own. This activity would also be a good way to tell me where specific students’ misunderstandings were, and would be a good way to plan how to differentiate instruction when students come into class the next day.
For the in-class part of this flipped lesson, I would plan some sort of extension activity that has students work together to build their own food chain or food web, and I could help individual students with misunderstandings surrounding the topic for those who need that individual scaffolding.
To add some spice to the class and really relate to the kids while teaching them about trends and graphing data, I’d love to use the bookworm movies site. Just browsing the site and playing with it was really cool. So cool, in fact, that I would definitely want my kids to play around with it for a while and see what they would think about it. By the way, this would definitely work well with a class/unit/lesson dealing with collecting data, analyzing trends, etc.
Here’s how the lesson would look like (coming to you live from my brain):
5 Minutes: Take a survey of the class concerning their favorite movie/genre of movies. We would use this data to come up with a graph. From this data, we would also list the different stereotypes (archetypes?) that are common throughout that genre of movie, ie hero always saves the day, the nerdy girl is always asked out by the popular guy, red coats die first, stormtroopers always miss, etc. etc.
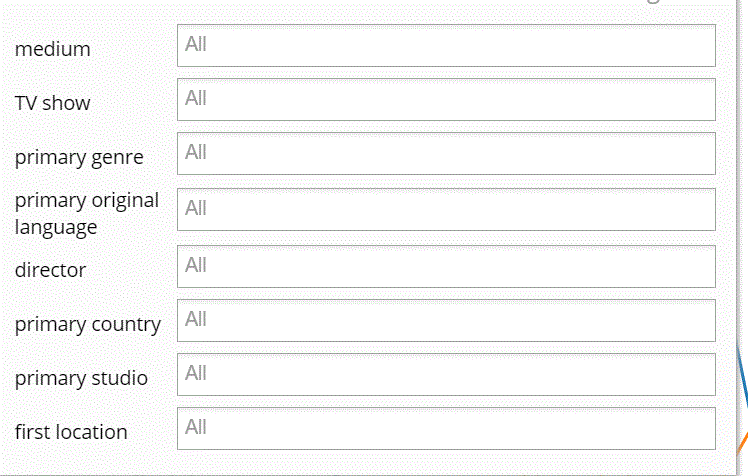
15 Minutes: The next part of the lesson involves introducing the students to the website bookworm: movies and having them search those phrases. Using this website, the students are able to filter the results they get.
In the image above, you can see just how specific students will be able to be when searching for phrases and/or individual words. During this introduction, the teacher/facilitator will give the students 2-3 example searches to test out on the site, just so that the students become familiar with the site and its features. The students will then be turned loose and left to their own devices; searching for words/phrases that either pertain to their favorite movie genre, or just phrases/words in general that they’d like to see data on.
5 Minutes: Yoga break! Students will be asked to turn away from their screens for some body moving time or optional class yoga. Studies show that students start to lose interest (basically shut their brains off) 30 minutes into a lecture/class/whatever it is that they’re doing and they’re not particularly interested in. So be proactive and get your students active!
Remainder of class: The remaining class time will be set aside for discussion. After the yoga/movement break, students will go back to the data they’ve looked up and share it with the class or in groups (whatever tickles the teacher’s fancy). The class will then be asked the following questions:
Were there words/phrases that you tried to look up and couldn’t find? Why do you think that was?
What did you notice about the trends in the data and the time period during which they occurred?
Pick a graph comparing at least 2 phrases. (Pretend they picked the one below)
What do you predict will happen to this graph in the next 5 years? 10 years? How do you think the usage of these words/phrases will change over time?
And That’s a Wrap! : Students will then record their findings in either a journal or on a separate piece of paper and turn that in.
Aaaaaaaaaaaaaaand cut! You’ll be the coolest teacher around with this lesson. Guaranteed. (But not really. Don’t quote me on that. I don’t know the dynamics of your class and how they might react to this lesson. Just try it man. Nike.)
I would have my students use Ngram to write about trends in literature pertaining to the use of God and the Devil. They would have to differentiate between actual religious texts and literature and make assumptions on the time period based on what they find. I really like this website because it shows somewhat perfectly what was written during a certain specific time period. I am free to incorporate history in the lesson due to time being such an important thing while using Ngram. This will also help the student’s research skills immensely–for they will have to interpret information based off of the graph that Ngram shows.
One thing I do not like about Ngram is how cluttered it is when looking at the books used in the graph. I wish there was a better way to sort through each book presented. I think that a better algorithm would help student’s research immensely. Other than that, I think it is a fantastic tool for seeing what words were used during certain specific times, as well as seeing how popular they were.
I find it absolutely fascinating that the word “devil” appears more in the 19th century than the word “god”. I am not surprised by it, but still fascinated. I think if a student had little knowledge of the literature being put out during the 19th century, they would be shocked by this fact. This is why Ngram is a great tool. It combines academic research and purely satisfying facts–the kind of satisfaction one gets when mindlessly reading Wikipedia.
I hope that one day the program will be updated so that more-than-three-word-phrases can be looked at. That should be a pretty easy thing to do, right? If that were the case, then everyone would be able to be a linguist! We’d be able to look at phrases and see where they were from and how much they were used. I think it is necessary for Ngram to develop an algorithm that would allow us to do this.
**The website is not allowing me to add a picture to featured image**
I remember using Gapminder World in High School. I specifically remember using it sophomore year when (as a grade) we were participating in a model United Nations. It gave teams the opportunity to learn large amounts of information quickly about both their country and other countries. It was a great tool and I was excited to plan a lesson around it after last class.
Picture a science health class in a 1-1 school (which is where I dream to be eventually). The students have just finished a unit on different global diseases and this is their final project and assessment for the unit. In groups of two, students will pick a disease that Gapminder World has data on. Once they pick the disease they want to learn more about for their project the objective is to determine what are major influencing factors for that disease. For example, if I picked Malaria then I would chose different factors such as GDP, Education, Poverty and observe their influence on Malaria. Once I have manipulated and analyzed the different graphs the students will chose 1-2 factors that they want to research more.
The students will research the disease itself if it was not covered during the unit within the class. Finding information such as: how you get it, symptoms, and is there a cure? They will also research the affect and impact that the one-two different factors had on their disease. The students will get multiple days to accomplish this. At the end they will have created a poster, presentation, video or some method of representing their group research. In class there will be a gallery walk where students will set up their project and get to walk around the classroom and see everyone’s research.
Lesson Objectives:
Students will be able to manipulate and interpret data of a health disease to determine important factors.
Students will be able to research their disease and important factors after analyzing and interpreting the data.
Final Product:
A representation of the research on both the disease and its important factors. Could be a video, poster board, presentation, etc.
For an assignment such as this one I wanted to do a student led project. I wanted students to be invested in what they were researching so I let them chose their own disease. I also wanted to let students use their creativity and imagination in presenting their findings. Often assignments and projects in classes tend to be very scripted so I wanted a project with more freedom.
I also wanted the students to be able to play around with the program and learn how it worked along with the different methods it has for representing data!
In middle school and high school, I heartily looked forward to science classes each day. They were a chance to ‘experiment’ – to play, test, follow curiosity – and yet, somehow, through this, learn. What a radical idea: the combination of natural interest and discovery and education! But all sarcasm aside, teachers are testing more ways to make learning fun, memorable, and meaningful. Labs need not be limited to a science classroom. Indeed, flipped learning as a strategy for any class attempts to take advantage of technology to give students the best of both worlds: interesting lessons and non-drudgery homework in the form of class ‘explorations’ or other active learning strategies. There is huge potential in using technology for this purpose, and as teachers, we can continue to learn by trial and error, using our imaginations (and the scope of the internet) to craft new lesson sequences and see what is effective.
Here is my attempt at creating such a lesson for a high school trigonometry or Pre-Calculus class learning about the Unit Circle.
Learning Objective
Students will be able to label the Unit Circle on their own, using intuition. They will be able to identify the patterns that the trig functions follow. Furthermore, they will be able to explain how we derive trig values from special triangles on a circle of unit radius. Finally, when given a major angle measure, they will be able to return the corresponding sine, cosine, and tangent values, or vice versa, given trig values to match with angle measures.
Digital Resources for Flipped Elements
This lesson will work off of Bloom’s Taxonomy. Students will begin with “homework” to do the lowest level of thinking to memorize the basic values of the unit circle. They will have at their disposal multiple tech tools to do this, as students learn in a variety of ways.
Visual learners might want to utilize these programs on Desmos and Geogebra, which help students to connect the dots between shapes/spaces and trig values.
Desmos Unit Circle Exploration: I especially like the use of colors on Desmos – never hurts to make math prettier and more appealing!
Geogebra Unit Circle Exploration: Note how there is a slider which helps students visualize the effect of radian measure on trig value.
Students more inclined to numerical or algebraical thinking might want to use a chart (especially an interactive one like this), which shows patterns among trig values to ease memorization.
Clicking “Show” or “Hide” reveals the corresponding trig value in the chart, making this like a matching game.
The objective of this beginning stage is to gain comfort with the idea of radians, triangles inscribed in a circle, and the connection between angles and trig values. At this point, students should develop a base knowledge of trig values in relation to certain radian measures, but I would not expect them to understand the significance of these values.
Active Learning Strategies – Interactive, Collaborative, Digging Deep
The next part of the blended lesson is the in-class work, which here will consist of active student participation in a “lab” to get to the root of the importance of the unit circle. Students would work in groups, following a lab procedure that would lead them through activities looking at recognizing and questioning the qualities of the circle. At sporadic points throughout the lab, I might draw the class together to make important points or to give them hints on how to proceed, but their background knowledge should give them the foundation to proceed more or less independently. Finally, at the end, we would come together as a class to review our findings and discuss how this new material will benefit us in the coming unit.
How Will the Lesson Flow?
Using a flipped lesson sequence frees up time to focus on deeping students’ learning in class. By intentionally guiding students’ focus from basic to more advance studies of the circle, my hope is that they will not feel overwhelmed by the unit circle and instead give each aspect of it its due diligence and attention; ultimately, this should pay off in gaining both a general knowledge and a more application-based ability concerning the unit circle.
Why Use the Blended Model for this Lesson?
The goal of this lesson is for students to develop an intuitive understanding of the unit circle in order to be fully prepared to deal with all things trig-related in the following units. The unit circle is hugely important and often not covered in due depth. It may seem that math teachers’ insistence on knowing by heart the values on the unit circle is overboard, but really – they are not deceiving you in telling you that knowing this material like the back of your hand will pay you back several fold as you continue in math. More critical even than memorizing the values of the circle and a much more thorough way of learning the circle, in fact – is being able to derive these values. From what do they stem? How are radians related to measures of a circle? How are trig functions tied to coordinate points? How do we convert between trig functions, or even undo trig functions with inverses? These are the deeper questions that students should be able to answer.
Students will be able to find the derivatives of sinusoidal functions.
2. Digital Resource(s)
Before coming to class, students will watch an online video that I will create of me proving and .
3. Active Learning Strategies
Once students have an idea where the equations come from, they can use the freed up class time to solve problems where they are asked to find the derivatives of sinusoidal functions. One active learning strategy that I might employ is Numbered Heads Together. I will split students into groups of three or four and have them collaboratively work on problems that I will provide. One randomly selected student from each group will then provide a brief explanation of how their group went about solving the problem. Students who would have difficulties solving the problems on their own will have the benefit of group members to help them out.
4. Lesson Flow
The video explains to students where the equations and come from. I will begin class by demonstrating to students how we can use these equations to find the derivatives of various sinusoidal functions. The example problems will require the use of techniques taught in previous lessons such as the power rule, the product rule, and the chain rule. After the example problems, students will be split into groups for the Numbered Heads Together activity where they will solve some problems in groups. Finally, students will be given some homework problems to work on individually for the last part of class.
5. Benefit for Students
As a math teacher, I dislike presenting a formula or equation to students and asking that they believe it on blind faith. I really believe that students benefit from seeing where formulas come from and why they work the way they do. However, in many classes (especially calculus), there are simply too many equations to offer a formal proof for each one during class time. By flipping this lesson, students are able to see where the equations and come from, and I won’t have to use class time to prove the equations. Instead, students can use class time to collaboratively work on problems where they will apply the equations. This is preferred to having students work on problems at home, where they would not have a teacher or classmates to help them out if they get stuck.




 in any way that they wish. I would instruct them write down what they observe as they do so. After they have had some time to explore, I might provide a worksheet for some more guided practice. The worksheet might ask them to do things such as add a constant to the equation




 and
 .