1. Learning Objective
Students will be able to find the derivatives of sinusoidal functions.
2. Digital Resource(s)
Before coming to class, students will watch an online video that I will create of me proving  and
and 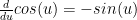 .
.
3. Active Learning Strategies
Once students have an idea where the equations come from, they can use the freed up class time to solve problems where they are asked to find the derivatives of sinusoidal functions. One active learning strategy that I might employ is Numbered Heads Together. I will split students into groups of three or four and have them collaboratively work on problems that I will provide. One randomly selected student from each group will then provide a brief explanation of how their group went about solving the problem. Students who would have difficulties solving the problems on their own will have the benefit of group members to help them out.
4. Lesson Flow
The video explains to students where the equations and come from. I will begin class by demonstrating to students how we can use these equations to find the derivatives of various sinusoidal functions. The example problems will require the use of techniques taught in previous lessons such as the power rule, the product rule, and the chain rule. After the example problems, students will be split into groups for the Numbered Heads Together activity where they will solve some problems in groups. Finally, students will be given some homework problems to work on individually for the last part of class.
5. Benefit for Students
As a math teacher, I dislike presenting a formula or equation to students and asking that they believe it on blind faith. I really believe that students benefit from seeing where formulas come from and why they work the way they do. However, in many classes (especially calculus), there are simply too many equations to offer a formal proof for each one during class time. By flipping this lesson, students are able to see where the equations and come from, and I won’t have to use class time to prove the equations. Instead, students can use class time to collaboratively work on problems where they will apply the equations. This is preferred to having students work on problems at home, where they would not have a teacher or classmates to help them out if they get stuck.
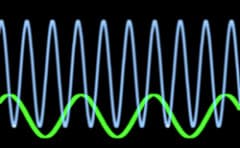
Image credit: Creativity103


 in any way that they wish. I would instruct them write down what they observe as they do so. After they have had some time to explore, I might provide a worksheet for some more guided practice. The worksheet might ask them to do things such as add a constant to the equation