Throughout this past semester at the University of Portland, I have had the opportunity to learn about various forms of educational technology and learn ways to incorporate them into my own math classroom. In today’s world, we are surrounded by technology and it’s important to understand how to implement it in your classroom. While it might not be realistic to incorporate technology in every lesson, certain educational technologies can be useful in supporting students’ learning.
As I learned about various educational technologies this semester, I made a digital portfolio on WordPress to showcase lessons, assessments, or reflections I have created about that specific technology. Below, I have linked three of my favorite lessons that I created this semester using different educational platforms.
April 26, 2033

Dear former me,

It seems like only yesterday, I was at UP. It was the spring term, 2023. SO much has happened since then. It is hard to believe that a decade has passed since I started my journey as a teacher. As I write to you now, I am filled with a range of emotions - a sense of accomplishment, pride, and gratitude. The past ten years have been an incredible rollercoaster ride filled with challenges, but I have learned to love the job more with each passing year.

There have been days when I felt like giving up, and the challenges of teaching seemed overwhelming. But it was the love for my students and the impact I was making in their lives that kept me going. Seeing the light bulb moments, the spark of curiosity, and the joy on their faces when they understood a concept made it all worth it.

As I reflect on the past ten years, I realize that teaching is not just a job; it is a calling. It requires patience, empathy, creativity, and a deep sense of purpose. It is not for the faint of heart, but the rewards are immeasurable.

I have had the privilege of working with some incredible students, colleagues, and administrators. They have challenged me, inspired me, and made me a better teacher. I am grateful for the experiences and the lessons learned.

As I look ahead to the next ten years, I am excited about the possibilities. There will be more challenges, but I am ready for them. I will continue to grow, learn, and evolve as a teacher. Most importantly, I will continue to love the job and the impact it has on the lives of my students.

Enjoy the next ten years! It goes by faster than you would think!
This lesson is designed as a professional development for K – 12 educators. The goal for this lesson is to introduce fellow teachers to PhET, an interactive website for Math and Science education. In this lesson, we will…
See, Think, Wonder about PhET
Share ideas for how to use PhET in classrooms
Show all the resources PhET has to offer
Brainstorm ways of using PhET in your own personal class
In order to create this lesson, we used PhET, Google Slides, and Jamboard. Google Slides is used as a way of presenting information to the class about PhET and Jamboard is used for the class to easily collaborate digitally.
This lesson would be used as an introductory lesson into trigonometry. The goal for this lesson is for students to be able to develop a sense of understanding of trigonometry while using different online tools to assist them.
Above, I created an eight question Trigonometry Quiz that I would use in my Geometry classroom. This quiz has a variety of question types and is self-graded. Students would be able to take this quiz and immediately get their score. This is very useful as it grades the quizzes immediately, I can quickly see which students are struggling or excelling in this topic, and I can see which questions were the hardest for students. Using this type of technology gets rid of the time teachers need to grade assessments and analyze test scores. I did find Google Forms is a little tricky when trying to type math equations. I found that in order to properly type math, you would need to install a separate extension that allows you to import math equations into the Form. Hopefully, Google will add an “Insert Math Equation” function soon like they have in Google Docs.
The next Google Form I created was a branching form for my Algebra 1-2 students. I designed this form as a check-in quiz where my students could test their skills on solving one-step equations and I could also see who needs more support. The form is designed in a way where students see one question at a time. If the student answers correctly, they move on to a new problem. If the student answers incorrectly, they are directed to a video and then can try the problem again. While making this form was very time-consuming, I really like the idea of utilizing these types of forms in my classroom. Branching forms can be a great way to build in more individualized supports in the classroom.
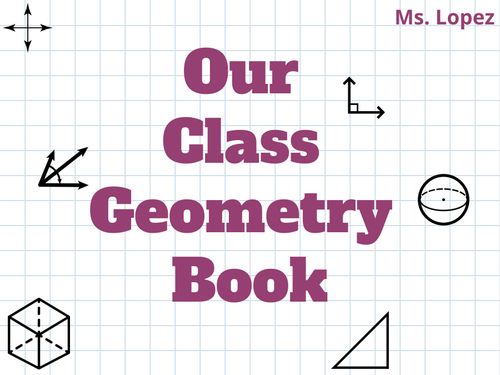
This week, I create a book using Book Creator designed for my high school Geometry class. Throughout the year, my students fill out important vocabulary, theorems, and definitions in their own personal reference packet. I thought I could use Book Creator to create a fun, interactive, and digital book of those important terms for students to use. When students are absent, they can look at this digital book to fill out their reference packet.
For this assignment, I made a demo book that could be used in my Geometry classroom. I divided the book up by units, so students can easily categorize definitions. I also put the lesson it was from in the unit, so students can easily write down terms from the lesson they missed. For the Pythagorean Theorem, I also included a voice recording of me saying “Pythagorean Theorem” because students often forget how to pronounce this important theorem. Because this was a demo book, I only included a few definitions and theorems from Unit 2 and Unit 3. However, if I utilized this in my classroom, the book would cover every unit and theorem we discuss in class.
Overall, I really enjoyed using Book Creator. I found it pretty easy to use and was impressed by its many functions. It was very customizable and simple to add in fun features. I particularly liked the recording feature. This is a great tool to record hard to pronounce words or even use as a fun read aloud feature.
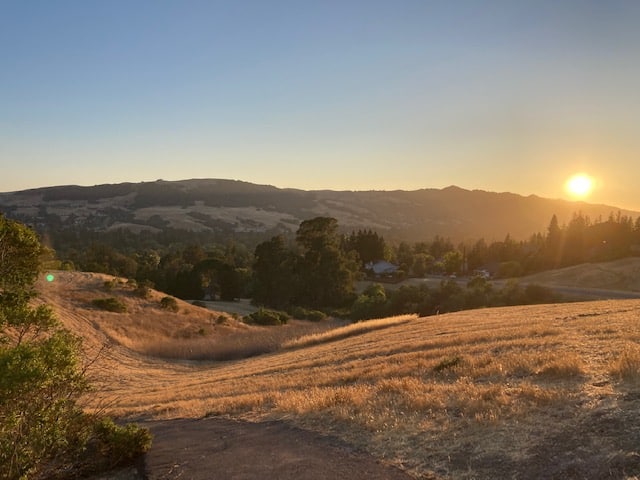
I am from the foothills of Mount Diablo, from streets lined with sycamores and oak trees. I am from day trips to San Francisco, and camping under the moonlights’ glow.
I am from family who shows love with food, from the scent of empanadas in the air. I am from a mom who loves to laugh and a dad who never drinks decaf.
These are the moments that shaped me, surrounded by friends and family.
For a direct link to my poem on Microsoft Sway, click here!
For my digital story, I chose to use Microsoft Sway. I liked how Sway lets you create a slideshow presentation with your pictures. As this was my first time using it, I found Sway to be pretty user-friendly. I especially liked the function of being able to insert photos directly into the presentation. It was helpful that Sway generated suggested photos based on the text in my presentation, as well. I did find Sway to be slightly challenging to customize my presentation. I wish I could have moved the text in my presentation around, so it wasn’t directly on top of some of my images. However, this wasn’t a huge issue after I played around with different fonts and got rid of the text highlighting.
This lesson is designed for middle school students to apply their area formulas to real life locations. Ideally, students would have learned and had some practice already with the different area formulas. This activity would give them some more practice with the formulas and also let the students see how these formulas can be applied in real life situations.
Instructions
For this lesson, students will have the freedom to choose a location that they find interesting. Students could pick their school, a city, a country, or have a more general theme, such as landmarks. Students will work in groups to find the area of at least five items on their map. For example, students could find the area of a local park in their neighborhood, the area of a city block, or the area of a body of water.
Each group will create a custom map and label the five places they found the area of. Students will be able to use the measure feature on My Maps, but they will need to use those measurements to find the entire area of the location.
Example
In my example below, I found the area of three locations on the University of Portland campus. I used the area of a circle to find the area of Chiles Center, the area of a rectangle to find the area of Merlo Field, and the area of a triangle to find the area of small patch of grass in the Academic Quad. Students will be expected to label the location with the area and the formula(s) they used.
The high school I am student teaching at is currently in the midst of our Black Lives Matter Week of Action. When I was lesson planning for this week, I was having a hard time finding a way to connect geometry and the week of action together in a meaningful way. In geometry, we are specifically learning about solid geometry. In order to get some inspiration, I turned to ChatGPT. I typed in: “Make me a high school geometry lesson for the BLM week of action that ties in solids. ChatGPT responded back:
Here is a lesson plan that combines solid geometry and the Black Lives Matter movement:
Objective: To understand solids of rotation and slicing solids and to connect them to issues of social justice.
Materials: Whiteboard, markers, manipulatives (such as clay, Play-Doh, or paper), ruler
Introduction (5 min):
Begin by reviewing the basic properties of solids of revolution, such as cylinder, cone, and sphere.
Ask students to think about real-world examples of each solid shape, such as a can of soda, a traffic cone, and a basketball.
Connecting solids of rotation to Black Lives Matter (5 min):
Transition to the topic of Black Lives Matter and why it is important to learn about it.
Explain how inequalities in society can be visualized as slicing solids, where certain sections are larger or smaller than others, representing unequal access to resources and opportunities.
Show examples of how systemic racism creates disparities in areas such as education, employment, and healthcare.
Hands-on activity (25 min):
Divide the class into small groups and ask them to work together to create a model of a solid of revolution that represents a specific aspect of social justice, such as income inequality, educational disparities, or police brutality.
Encourage the use of slicing techniques to show the unequal distribution of resources and opportunities.
Have each group present their models to the class and discuss how they used geometry to visualize and understand the issues they chose.
Conclusion (5 min):
Summarize the key points of the lesson and emphasize the importance of using geometry to understand and address social justice issues.
Encourage students to think about how they can use their skills and creativity to make a positive impact on their communities and promote equality.
Assessment: Observe students’ participation and creativity in the hands-on activity, and assess their understanding of the connection between solids of rotation, slicing solids, and social justice issues through a written reflection.
ChatGPT’s initial response intrigued me, but I was left a little confused about how societal inequalities could be represented by slicing solids. Therefore, I responded back to ChatGPT with “What’s an example of how inequalities in society can be visualized as slicing solids?” In seconds, I received the following:
For example, imagine creating a cylinder to represent access to quality education. The height of the cylinder represents the level of education achieved, with the top being the highest level (such as a PhD) and the bottom being the lowest (such as a high school diploma). The radius of the cylinder represents the number of people with that level of education. A slicing plane could be used to represent the racial divide in education, with one half of the cylinder representing Black students and the other half representing white students. If the height of the cylinder representing Black students is shorter than that of the cylinder representing white students, this would demonstrate the unequal access to quality education for Black people.
This type of visualization can help students understand the impact of systemic racism and inequality, and can also serve as a starting point for discussions and actions to address these issues. By using solid geometry to represent real-world problems, students can apply their math skills to analyze and understand complex social justice issues in a meaningful and engaging way.
While I did not end up using the ChatGPT lesson, I still had a lot of fun exploring the functions of Artificial Intelligence. I’ll admit at first I was a bit freaked out by the capabilities that ChatGPT offered, but I have grown to find some of its functions worthwhile. My favorite aspect is that it feels like you are having a conversation. As long as you are in the same chat, you can ask it follow up questions and for examples, as needed. For the specific lesson plan it created, I really liked how it creatively tied together geometry and social justice. However, I do think the timing for the activities it provided were a little off. At least for my students, there is no way they would spend 25 minutes building something with Play-Doh. Overall, I will definitely use ChatGPT again as a way to brainstorm lesson ideas!
Credits: Title: Created by ChatGPT with the prompt “Write me a clever title for a blog post about using ChatGPT for lesson planning” Featured Image: Created by Lexica with the prompt “high school students making geometrical solids out of Play-Doh” Lesson Plan & Follow Up Response: Created by ChatGPT
I am currently student teaching in a high school geometry class. Recently, we went through a version of this lesson as we began learning about the Pythagorean Theorem. My original lesson had a photo from the Capitol Crawl of activists crawling up the steps of the Capitol building in Washington D.C. Unfortunately, I couldn’t find a public domain photo to use, so I made a few edits to the lesson in order to incorporate copyright free images.
Lesson Instructions for Students
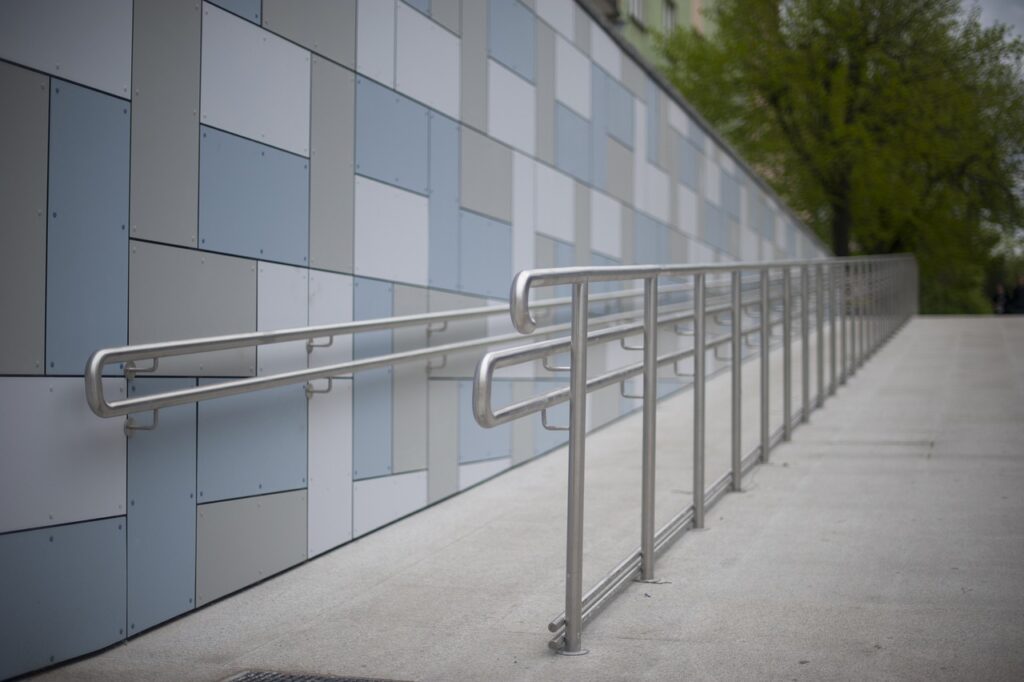
First, take a minute to look at the four pictures shown below. How do they relate to each other? How are they different? As you begin to make sense of the photos, answer the following questions in your notebook: – What do you notice? – What do you wonder? – What’s a connection you can make? – What’s a mathematical question you can ask about the images? After you have answered the four questions, we are going to go around the class and share at least one thing you wrote down.
As students share out their responses, I will write down their answers on the board for all students to see. My hope with this discussion is that themes of accessibility, safety, and inclusion arise. After this discussion, I will talk about the Capitol Crawl where disability rights activists crawled up the 100 steps of the Capitol Building. In 1990, the Americans with Disabilities Act was passed which required accessibility requirements to public spaces. After this conversation, I will then ask my students, “What characteristics make a ramp safe?” After brainstorming some characteristics of a safe ramp, I will share the ADA guidelines for ramps.
Americans with Disabilities Act Ramp Guidelines
Ramps are required for any chance in level greater than 1/2 inch
Ramps have a maximum slope of 1:12 (4.8 degrees)
Ramps have a minimum width of 36 inches
There must be a minimum 5 feet by 5 feet flat area at the top and bottom of the ramp for turning
Ramps may be no longer than 30 feet horizontally between flat rest or turn platforms
Group Activity
For the rest of class, students will work together in groups to design a ramp that meets the given scenario and ADA guidelines. Students will have to use the Pythagorean Theorem in order to get accurate measurements.
A school has 4 steps to the front door. Each step is 7 inches tall. Design a ramp for the school that meets the ADA guidelines.
This week is finals week at the school I am student teaching at currently. I teach Algebra 1-2 and Geometry. Today, I had three periods of Algebra with all 9th graders and it was CHAOS. Let’s recap the day shall we…
6:30am
My alarm goes off and I stumble out of bed.
6:45am
I make my lunch. On the menu this week is taco salad!
7:00am
I eat breakfast and read my book.
8:00am
I drive to school and blast some pump up music to get myself excited for the day.
8:30am
First period begins… Almost the entire class waited until the day their final project is due to begin working on their project.