
Lesson Context: This video is intended to supplement instruction during my students’ asynchronous class period. It is in the middle of a unit on Supply and Demand, and we just learned about the Law of Supply in the previous synchronous lesson.
Audience: The audience for this video is students in my 10th grade Economics class or anyone else who wants help learning Economics.
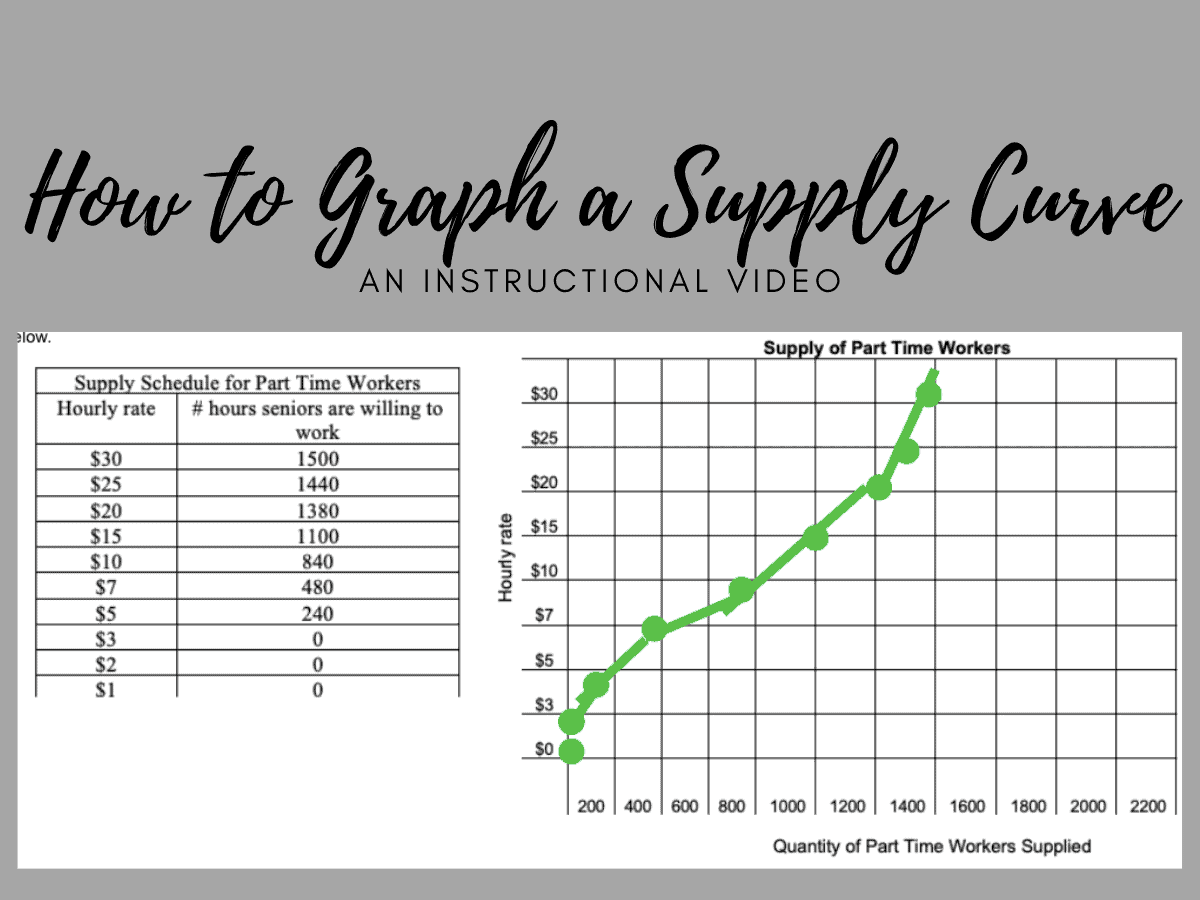
Purpose: The purpose of this video is to aid my students in understanding how to take information from a supply schedule and graph it to create a supply curve. This is intended to help them with their asynchronous assignment, which asks them to graph supply curves.
Using A Screencast: Recording a screencast of this process helps my students’ understanding of their assignment because to illustrates the step by step process they should follow. This is especially helpful during asynchronous classes where I am not there to help them in person.
Video: How to Graph a Supply Curve
I really like your video for this lesson! It is a very good visual and verbal explanation of the problem and you go through it step by step to make sure no students are getting lost! Great job!
Well planned and delivered. Good sound quality using a credible “teacher voice.” I like that you add side comments as you narrate the schedule. The tone continues in a casual, but informative tone.
Good explainer to help students understand the slope in both graphic and narrative basis. Great idea to “fast forward” it keep time down without losing instruction thread