
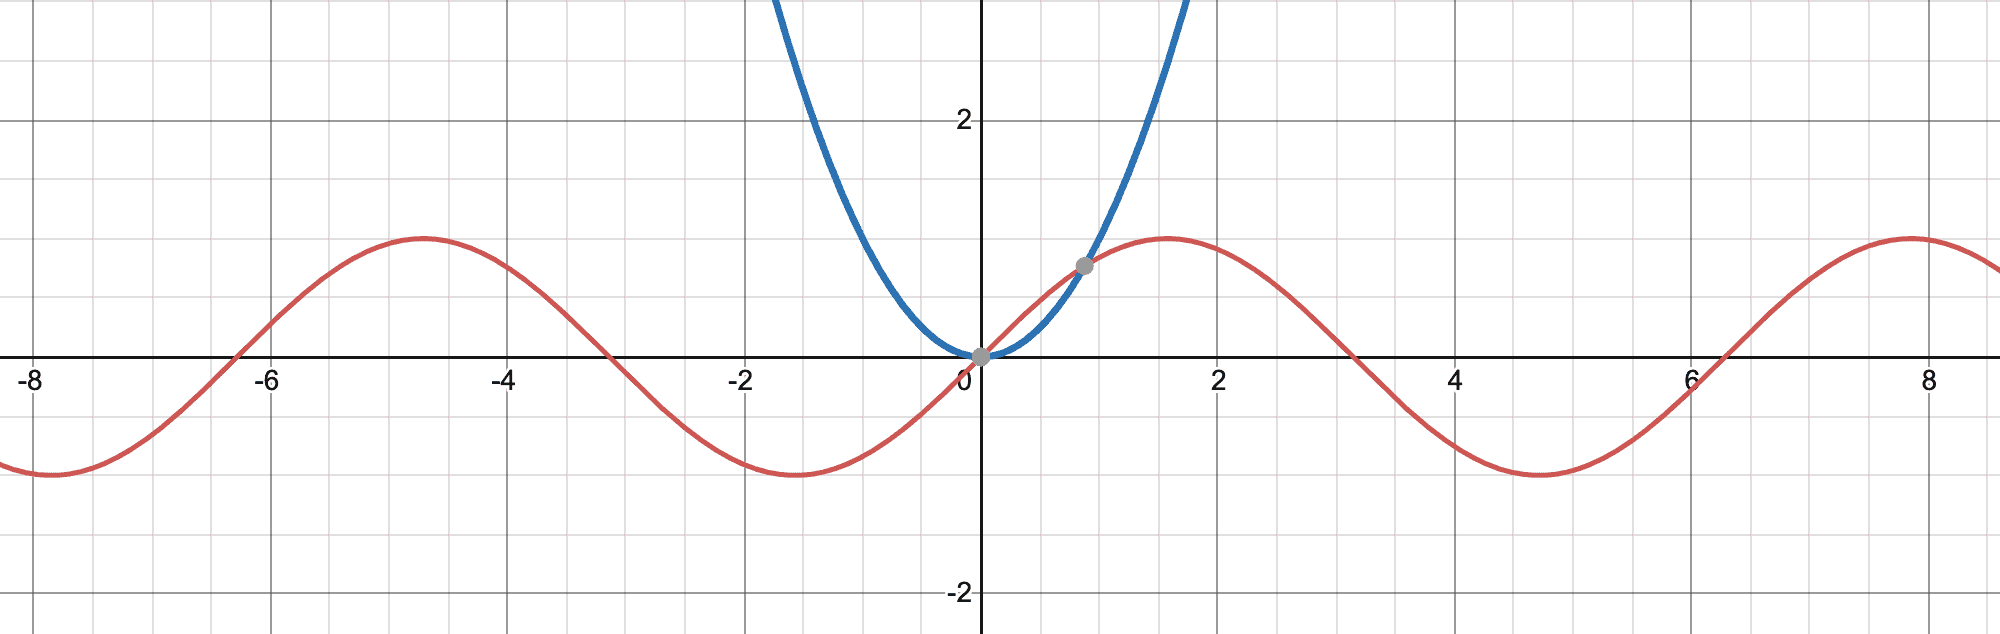
For my activity, I used a screencast to demonstrate how to use a feature of Desmos that will be helpful for their activity. I showed how students can use a slider to see the effect that a constant value has on a given graph of f(x). I demonstrated the effect that c, a constant, has on a graph of f(x) = c x2. I showed how once a constant is used in an f(x) function in Desmos, there is an option to add a slider for c.
Once the students have watched the demo, I would ask them to do the same for the functions, f(x) = a + b x + c x2. I would ask them to describe the effect of a, b, and c as they become greater, smaller, and negative. I would also ask them to look at f(x) = sin(a x) vs f(x) = b sinx and compare the effect of a vs. b.
This screencast helps students understand how to use this feature in Desmos if they do not yet know how to use it. The activity goal is for student be able to understand visually the effect that constant have on the f(x) functions they have been looking at.
What a great app to share with students. I like how you adjust the sliders and the graphs change accordingly. Good way to help students visualize the underlying math behind the equations. Good video “explainer”
Hi Chantal,
I LOVE using Desmos with my students. This is such a unique way of using Desmos and screen casting to make a lesson. Often my students need reminders of how to complete their homework when it is after school hours and so creating reminder videos like these would be great for that purpose!
Hi Chantal, I like that this video is short and sweet! You get your content across in a clear and concise manner. Desmos seems like a great tool for math, I might try incorporating it into my Economics class!