Un-forgett-able Affixes!

Hello 3rd graders! For today’s homework activity, we will be reviewing affixes. Let’s think back on today’s English lesson and try to remember what an affix is. Do you remember it? It’s okay if you don’t because we’re gonna review it right now!

Affix: a group of letters that are added to the start or the end of a root word to create new words

We add affixes to all sorts of root words! A root word is simply a base word that can be changed by adding affixes. An affix that we add to the start of a word is different from an affix we add to the end of a word. We have different names for them:

Prefix: an affix that we add to the start of a word

Suffix: an affix that we add to the end of a word

Now let’s review what we’ve learned by listening to this fun song about prefixes and suffixes!

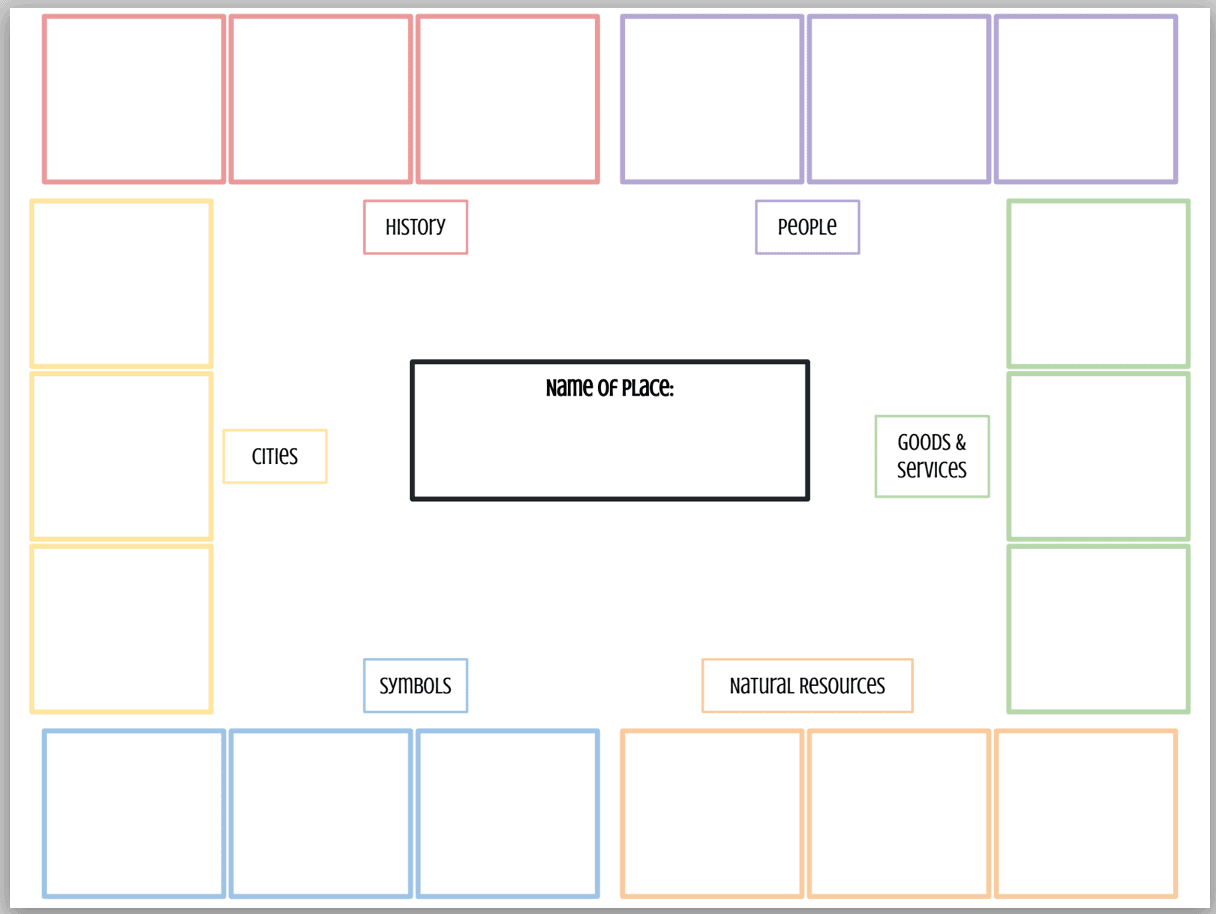
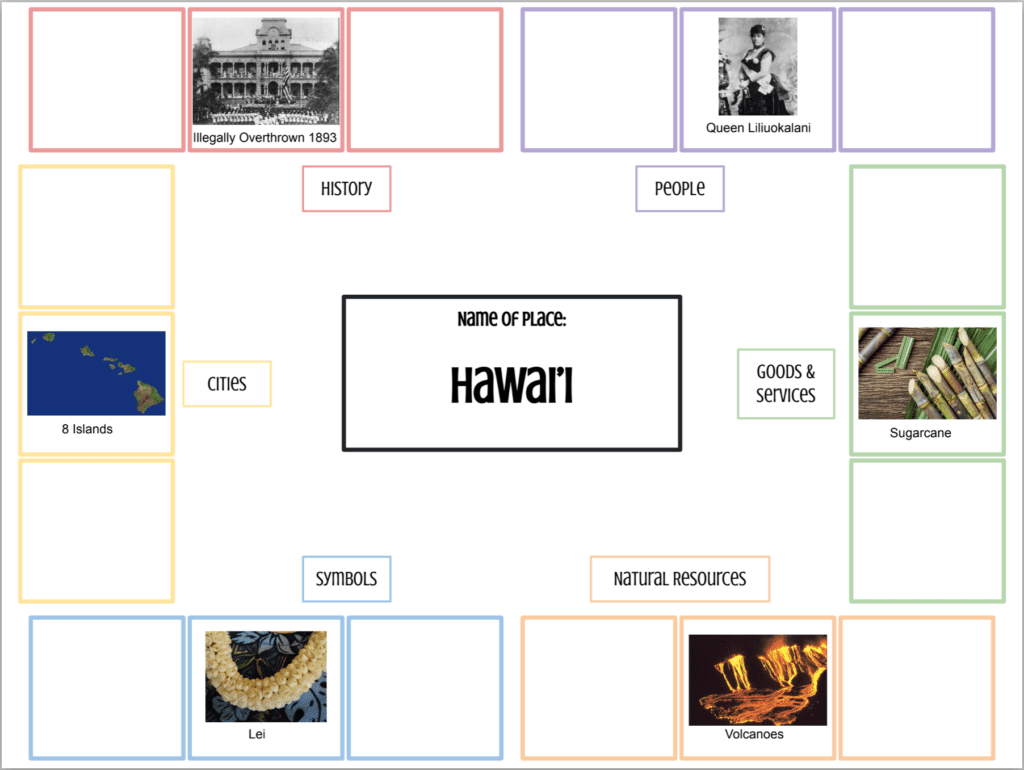
Now that we heard some examples of affixes, let’s do some prefix and suffix practice! Click this link and then press the blue button that says “Make a Copy.” You should see this Google Drawing:

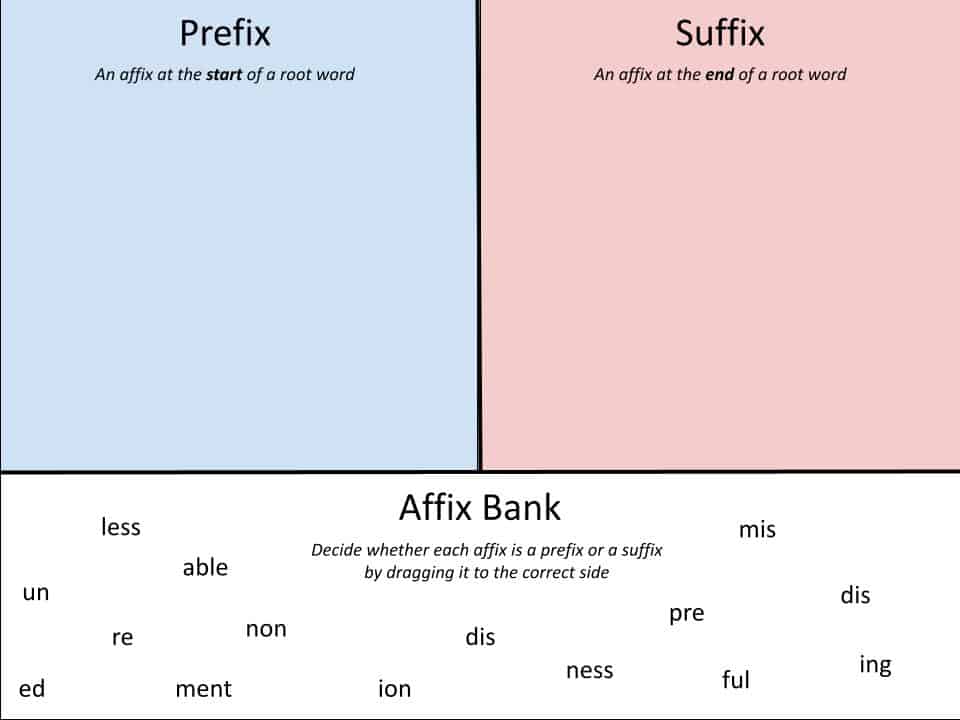
Drag the affixes from the white Affix Bank and place them where you think they belong: the prefix or the suffix side. Think about words you know that have these affixes. Were the affixes at the start of the word? Or were they at the end? Please do not look up answers and try your best on your own! We will review the answers when we meet tomorrow during class.

Featured image: Photo by Sven Brandsma on Unsplash

Telling Time!

Context of Lesson: First Grade, Mathematics, Telling Time

State Standard: Tell and write time. CCSS.MATH.CONTENT.1.MD.B.3 Tell and write time in hours and half-hours using analog and digital clocks.

Hello my first grade mathematicians! This week, we have been learning about how to tell time on both digital and analog clocks. Today, we will be focusing on reading an analog clock. As a reminder, when reading an analog clock the short hand is the hour hand. This means that whatever the number the little hand is pointing to is the hour of the day. In contrast, long hand is the minute hand and tells us the minutes of the hour! When looking at the clock, we count by 5’s! So if the minute hand is pointing toward the 1 then the time would five minutes past the hour and if it was pointing toward the 2 it would be ten minutes past the hour. By the end of today, we will be able to determine the hour and the minutes within the hour in order to tell time on an analog clock!

Now, we are going to be using a Google Drawing of a clock. I will be projecting the clock on the board and you will each get a white board and marker. I will rotate the hour hand (the short hand) and the minute hand (the long hand) and I want you all to write down the time on the white board. When prompted, you will hold up the whiteboard and we will compare answers!

(Teacher passes out the individual white boards and markers. Teacher displays the Google Drawing on the board and rotates the minute and hour hand to display different times. The hands are moveable; therefore, it will be simple for the teacher to rotate the arrows to the different times quickly. The teacher will instruct the students not to hold the board up until instructed. The teacher will go over the answer and count by 5’s each time depending on where the minute hand is to show the students the pattern. Do this 7-10 times depending on how well students seem to grasp the concept. This will act as an informal formative assessment because the teacher will be able to notice if students are struggling and will be able to see if students need more explanations and another lesson how how to read an analog clock.)

https://docs.google.com/drawings/d/e/2PACX-1vSyMfO9Tprg3u061M-t2ONgqXBoYg9ARfPOfCkDUdQi545WVnt9j6P6ih35SM-MJZBdDJlpmIwb4QHj/pub?w=960&h=720

Perimeter Practice

Photo by Daniele Levis Pelusi on Unsplash

Context: Post-test (check for understanding) Grade: 4th grade math Goal: Use google drawings to gauge where students are in understanding the concept of perimeter and how to find it.

Hello 4th graders! Today we learned how to find the perimeter of a shape (the total sum of all the sides of a shape). Before we move on, we are going to have a mini practice quiz, don’t worry, this will not be graded, I just want to make sure that everyone understands before we move on.

With this link, you may use the text box that says “perimeter,” to write down what you think is the correct answer.

https://docs.google.com/drawings/d/1kfcr2UeW5t5vXAv43x_zZehFbUFG7bObFYegSTIlMIU/edit?usp=sharing

You got this everyone!

A Trip Around the World

Context: Graphic Organizer

Grade Level: Third

Subject: Social Studies

Hi friends! Today we’re going to get started on our learning around the world project. Over the last couple of days we’ve been talking about the different concepts that a make a place special. Some of the things we had come up with were 1) the place’s history; 2) natural resources/sites; 3) goods and services; 4) symbols (festivals, beliefs); 5) cities and; 6) people.

If you open up your computer and go onto our google classroom page, you will see a new assignment that will be completed on google drawings. for this assignment, you can choose to work alone or with a partner and you will then fill out the google drawing template based on the research you do. Remember that this is the first step and we will be using these to guide our papers and presentations.

In the center block, you will put the name of the place that you plan on researching on. It cannot be a continent or a whole country – choose a state, province, county, etc.. In the colored boxes around the google drawing, you will insert a picture with a caption that relates to that category for your chosen location.

I started on one to show you all as an example. I did Hawai’i and I only included one picture for each category but you will fill out all three boxes for each category. You will also see that underneath each picture, I included a small one or two word caption that reminds me what the picture is of.

Goals for students:

  1. Understand different concepts that make a place unique
  2. Differentiate important ideas and facts from one another.
  3. Be able to use google drawings in a productive and organized way to keep track of thinking

Using Google Drawings for Place Value

Featured image photo by Annie Spratt on Unsplash

This lesson is designed for a first-grade math class for the following standards:

CCSS.MATH.CONTENT.1.NBT.B.2
Understand that the two digits of a two-digit number represent amounts of tens and ones. Understand the following as special cases:

CCSS.MATH.CONTENT.1.NBT.B.2.A
10 can be thought of as a bundle of ten ones — called a “ten.”

CCSS.MATH.CONTENT.1.NBT.B.2.B
The numbers from 11 to 19 are composed of a ten and one, two, three, four, five, six, seven, eight, or nine ones.

CCSS.MATH.CONTENT.1.NBT.B.2.C
The numbers 10, 20, 30, 40, 50, 60, 70, 80, 90 refer to one, two, three, four, five, six, seven, eight, or nine tens (and 0 ones).

For this lesson, first have students watch the video below.

Then, have students work in pairs to solve the Google Drawing below. Each group should get their own copy so they can move the place value blocks together.

Click on the photo to access the Google Drawing

Finally, have students go on a scavenger hunt around the classroom with their partner to see what other groupings of numbers they see. Collect a few ideas on the board when finished so students’ can share their work.

This lesson allows students to think of number pairings through a song, through block manipulative, and through applying it into daily life in a scavenger hunt.

Personalized Plate

Photo by Brooke Lark on Unsplash

Context of the Activity: Teach in a content area (health)

Target Student Group: 1st grade, health

This Google Drawings lesson is inspired by a lesson my CT taught while I was in the classroom for field experience last week. After being taught about what a balanced diet looks like and what foods fall into each category (fruits/vegetables, whole grains, protein), the students made their own plates by coloring in a blank template of a plate with their favorite foods. I thought it would be fun to try it on Google Drawings so they could add images of their favorite foods from the internet.

Instructions for students: Hi class! Now that we have learned what balanced plates include, we are going to create our own featuring our favorite foods. Remember that each day we need about 4-5 servings of fruits and vegetables, 6 servings of whole grains, and 3 servings of protein. A serving is one portion or amount of a certain food. So, if you have a sandwich with two slices of whole wheat bread, that counts for two of your six servings of whole grains. Now, we are going to be using Google Drawings to make our own plates. I made an example plate you can look at, but I’m hoping to see your plates filled with servings of YOUR favorite foods. Once you’ve add 4-5 photos of fruits and vegetables, 6 photos of whole grains, and 3 photos of protein, go ahead and label these foods on the side of your plate.

Goal for the Lesson: To help students learn about the components of a healthy diet. It will help them recognize what foods fall into which categories so that they can make smart, informed decisions about what they eat. The Google Drawing helps meet this goal because they can find photos of their favorite foods and sort them appropriately. The visual will help them differentiate between the categories of food.

Direct Link: https://docs.google.com/drawings/d/1kvDP5cPqXDrYb1eYpdGKPndGTh7XbpsBrJV5cE2hqFA/edit?usp=sharing

Mystical Mosaics!

Context:

Mystical Mosaics” will be a lesson on fairytales, magic, and other fictitious worlds. The use of Google Drawing will come from students being asked to create a mosaic of a character or creature read about in whatever magic or fairytale-like books are used during read-aloud. This lesson will be focused on showcasing student work using Google Drawings. The lesson is fit for younger grades, it is a great way to introduce K-2 students to the concept of fairytales and fantasy while also letting them learn a new style of art: mosaic art.

Instructions:

Teacher: What did you all think of Dragon’s Don’t Dance Ballet? [book is optional, any fantasy picture book will do]

Students: GOOD! READ AGAIN!

Teacher: Well I am glad that you all enjoyed the book. Now, what do we understand about fantasy and fairytales?

Students: It is make-believe and it is very magical.

Teacher: Very good, for today’s activity I want you all to pull out your laptops and go to Google Drawings. Here you will be making a mosaic of your very own dragon! Before we dive in, a mosaic is a style of art where you can make shapes or drawings out of smaller shapes and patterns. Here is my example. Ready? Begin!

Teacher: Ready? Begin!

Goals:

  1. To introduce and build a foundation around what the genres of fantasy and fairytale are for students.
  2. It gives students an ability to showcase their art skills.
  3. It pushes students to think of aspects to look out for to differentiate various types of fiction.

Sources:

Photo by Ashkan Forouzani on Unsplash

Plant’s Life Cycle

3rd grade science – formative assessment after learning about the life cycle.

Standard: 3-LS1-1.: Develop models to describe that organisms have unique and diverse life cycles but all have in common birth, growth, reproduction, and death.  

Hello 3rd graders!

Let’s start today as we normally do with a check-in! Last class, we learned about the life cycle of a flower. We are going to rate how confident we feel about our knowledge on a flower’s cycle on google drawing.

(If majority of class feels confident, proceed to formal assessment down below. If majority of class does not feel confident, do review first)

To demonstrate your knowledge, you are going to draw a model of the flower’s life cycle on google drawings. Fill in where the arrows are of what happens at each stage of the plant’s life cycle.

Great job 3rd graders!!

Starts with a Seed

Plant image by Daniel Öberg from Unsplash

Plant Life Cycle Moveable Activity

This lesson is for kindergarteners to investigate the plant life cycle. The goal of this lesson is for students to understand how a plant is a living thing and what characteristics make up their life cycle.

Stages of the Plant Life Cycle:

  1. Seed: Plant life cycle starts with a little seed.
  2. Germination: The process of the sprouting of a seed(s).
  3. Seedling: Young plant starts to grow towards the sunlight.
  4. Adult Plant: Adult or mature plants start to grow flowers or produce seeds in order to reproduce.

Google Drawing Activity:

Now that you have an understanding of the plant life cycle, here is an activity!

https://docs.google.com/drawings/d/1WVJg1ushmpEvQ-XarCpMECDnT_sE3di3XZFg9DdxDts/edit?usp=sharing

  1. Open up the google drawing provided using the link above.
  2. Drag and move the pictures of each stage to the correct corresponding stage title.
  3. Share your finished plant cycle with a partner!

Working on Bubble Maps

Hi friends, today we’re going to be working on what’s called a bubble map!

A bubble map has one big circle in the middle with the words or picture of the main idea or topic you’ll be working on. From the big circle, there will be lines going outwards that connect to smaller circles. In the smaller circles there will be details about the main point.

On Jamboard, we’re going to work on our own bubble map with the animals that you all did for your science projects. I’ve included a picture of something you can use as an outline for your own bubble maps. In the big circle it says “Animal of your choice” where you can either write, draw, or print a picture of your animal. In the smaller circles, it says things like “diet? habitat? mammal? predators? etc” and these are the things you researched about your animals.

As a class we worked together on an animal, we chose the penguin.

*Now you can either show the next picture I’ve included or use it as a personal reference to guide you and your class through a bubble map on penguins.*

On each slide after this one, there is a blank bubble map that each of you need to fill out. Go to your number assigned page and start working on your assignment. Don’t forget to put your name on the top before you begin.

Bubbles Photo by Alberto Bianchini on Unsplash

Jamboard “Show me How You Feel”

Okay Kindergarteners! It’s been a BIG day full of BIG emotions and before we get started on our reading, I want to check in quickly to see how everyone is feeling!

I want you to put your thinking caps on and think REALLY hard about how you’re feeling right now. Check in with your body, check in with your mind, check in with what’s been happening today, and think of a way to show how you’re feeling.

Image by stokpic from Pixabay

Use your iPad to open up the link on our SeeSaw post: https://jamboard.google.com/d/1YIOSPZxEQ-ebaXZEkz8Cuj-bC6Dq_v7oVx35_07Xxqc/edit?usp=sharing and find a way to show how you’re feeling. You can type how you’re feeling on a sticky note, draw a picture with the marker tool, or choose a photo that shows how you’re feeling right this moment!

Once everyone has their image on the Jamboard, each friend is going to have a few seconds to share with the class if they want to and explain why they chose to show their feelings in that way.

Image by manfredsteger from Pixabay

Counting Coins

Alright 2nd graders, today we are going to be doing a collaborative assignment, where you will get to work with your table groups on Jamboard! As you know, we’ve been reviewing how to count coins, as it is really useful for when you need to buy something, or when you’re getting change back after a purchase. Remember from yesterday, pennies are worth 1 cent, nickels are worth 5 cents, dimes are worth 10 cents, and quarters are worth 25 cents. If you don’t remember which coin is which, be sure to ask your table group or myself. Now, let’s have everyone open up the Jamboard link that corresponds to your table number!

Jamboard Link: Group 1

Photo by Josh Appel on Unsplash

Slide 1

For this first slide, count up each of the four groups of coins, and write down that number in a new sticky note below each group, or just edit the existing sticky note under each group. Do this work individually, but if you get stuck, ask your table partners for help first.

Slide 2

For the second slide, you may now work with your group to figure out how many coins you can put into each of the four sections, to match the given price tag. Remember, there are many correct answers for each price tag! Feel free to duplicate the coins, but only if you have run out of coins to use.

Slide 3

This final slide is similar to the last slide you did, except this time, you will be finding three different ways to represent 39¢.

Teacher instructions: Make sure to have a backup copy! If something happens to one of the Jamboards that the students are editing, you can simply copy the original again and send them the link to it. If you notice that a student tends to only use the same 2 or 3 types of coins, encourage them to use all 4.

Goals: This second grade math lesson is intended for students who have already had practice identifying coins, and who have at least some experience using them to match certain prices. The Jamboard is a useful tool in this lesson as it allows the students to use an interactive, visual representation of the math concepts they’re using, in a collaborative environment where they can get feedback from their peers. Each of the three slides challenges them to think about this topic in different formats, without straying from the intended purpose of the lesson.