Going into this class, I was super enthused to learn methods for using technology in the classroom. For me, being tech savvy used to mean being able to operate a document camera and to use Google Docs. Ok, well it was a little bit better than that, but this class has really opened my eyes to new tools that I did not know existed. It has also provided me with practical tips on the logistics of how I would actually use tech tools to enhance a class.
After trying out and experimenting with a bunch of tech tools, I would like to make a list to catalog some of my favorites as well as my brief reflections about them:
WordPress – Starting from a basic blog post to including video and site embeds, seeking creative commons license photos to accompany, and more, practicing using WordPress made me appreciate its friendly user-face and simplicity. Surely this will come in handy for blogging in the future.
Adobe Spark – While working on the class E book, we were introduced to this tool. I had too much fun testing the endless possibilities of creative design on this and can see many uses for its professional-quality images with words.
Google NGram Viewer – This tool for visualizing the rate of use of certain terms could be used in many classrooms and could connect topics therein to the real world.
Screencasting – Making screencasts was not as easy as it appeared and might take some practice to become proficient, yet it was a great way to present material on a screen and another option for how to explain material to students or give them resources to use outside of class.
Overall, this class was valuable because it tied theory to practice, a feat difficult to accomplish in an ed class. Again, I look forward to the future, curious about where ed tech will advance and how it will change the very nature of education. I trust that we will be good stewards of it and carefully implement it in prudent and effective ways.
Today we’re going to follow the path of a medieval Spanish guy who was known as El Cid, or the Lord. You can think of El Cid as the Odysseus of Spain: legendary, super-heroic, courageous, indispensable. This was a real man, an admired military commander and nobleman of medieval Spain who went on to become a mythical giant through the renowned Spanish epic poem entitled El Cantar del Mio Cid. What lingers and continues to inspire about this man was his unstoppable resolve, his ability to act fearlessly in the face of obstacles, and his ability to gain the support of even some of his enemies.
Our activity revolves around the Cid’s journey throughout his military campaigns. Using Google My Maps, we can create a map charting Cid’s stops along what has become the modern Camino del Cid, a trail that draws tourists to traverse the path of Cid and see many historic sights along the way. After reading some of the epic poem in class, we can go on to visualize the journey by creating this map, which allows us to add pictures and notes at different points along the way. Maybe some will be inspired to one day hike the route as well!
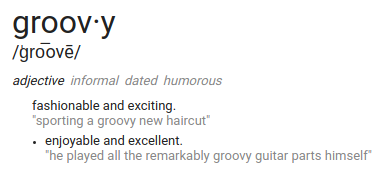
What is groovier than using the word groovy? Answer: Being able to use tech tools to realize the relative usage of the word “groovy” throughout time and thus conclude that perhaps your smooth colloquialisms might not be so smooth or hip after all. Good news: There is an abundance of alternative adjectives; maybe with some more research you can identify your optimal adjective of choice.
Which brings us to the reason for thinking about word optimization after all – as a slightly more creative method of learning about rates of change, critical points, and optimization in a Calculus class. I’ve designed a lesson that involves students researching word usage to apply the information they will have learned just prior.
After this lesson, students will be able to:
Identify on which intervals a function is increasing or decreasing.
Identify whether slope over an interval is increasing or decreasing at an increasing rate (accelerating) or a decreasing rate (decelerating).
Label critical points and make conjectures about the cause of these points.
Identify local and global maxima and minima (ie. extrema).
Apply the Extreme Values Theorem to a graph and explain why, when the conditions of the theorem are satisfied, it assures that the given point is a global maximum or minimum.
Basically, students will use Google Ngram to look up word usage over time and select a few of the resulting graphs to analyze to practice applying what they will have just learned about the topic in a fun way.
For example, students might look up the word “groovy” – yes, I said it again… I’m just helping the search rankings for this poor antiquated word to go up a tiny percentage (I should know better than this) – and the following result will appear:
I particularly like this example because of its graphical qualities – it has a clear increase and decrease and is not very choppy.
Once students have found a “nice” graph, they will then identify a given list of qualities such as maxima, minima, extrema, signs of the slope (derivative) within intervals, and signs of the derivative of the derivative (acceleration) within intervals.
Next, in order to connect this activity to real life, I will ask students to make predictions about why a word gained or lost popularity over a given time period. To make an informed prediction, they might research relevant events that occurred in the given time period and how this might then have affected common word usage. In essence, I want them to realize that graphs tell stories and that math is a tool that we can also use to communicate, illustrate, and explain these stories.
In middle school and high school, I heartily looked forward to science classes each day. They were a chance to ‘experiment’ – to play, test, follow curiosity – and yet, somehow, through this, learn. What a radical idea: the combination of natural interest and discovery and education! But all sarcasm aside, teachers are testing more ways to make learning fun, memorable, and meaningful. Labs need not be limited to a science classroom. Indeed, flipped learning as a strategy for any class attempts to take advantage of technology to give students the best of both worlds: interesting lessons and non-drudgery homework in the form of class ‘explorations’ or other active learning strategies. There is huge potential in using technology for this purpose, and as teachers, we can continue to learn by trial and error, using our imaginations (and the scope of the internet) to craft new lesson sequences and see what is effective.
Here is my attempt at creating such a lesson for a high school trigonometry or Pre-Calculus class learning about the Unit Circle.
Learning Objective
Students will be able to label the Unit Circle on their own, using intuition. They will be able to identify the patterns that the trig functions follow. Furthermore, they will be able to explain how we derive trig values from special triangles on a circle of unit radius. Finally, when given a major angle measure, they will be able to return the corresponding sine, cosine, and tangent values, or vice versa, given trig values to match with angle measures.
Digital Resources for Flipped Elements
This lesson will work off of Bloom’s Taxonomy. Students will begin with “homework” to do the lowest level of thinking to memorize the basic values of the unit circle. They will have at their disposal multiple tech tools to do this, as students learn in a variety of ways.
Visual learners might want to utilize these programs on Desmos and Geogebra, which help students to connect the dots between shapes/spaces and trig values.
Desmos Unit Circle Exploration: I especially like the use of colors on Desmos – never hurts to make math prettier and more appealing!
Geogebra Unit Circle Exploration: Note how there is a slider which helps students visualize the effect of radian measure on trig value.
Students more inclined to numerical or algebraical thinking might want to use a chart (especially an interactive one like this), which shows patterns among trig values to ease memorization.
Clicking “Show” or “Hide” reveals the corresponding trig value in the chart, making this like a matching game.
The objective of this beginning stage is to gain comfort with the idea of radians, triangles inscribed in a circle, and the connection between angles and trig values. At this point, students should develop a base knowledge of trig values in relation to certain radian measures, but I would not expect them to understand the significance of these values.
Active Learning Strategies – Interactive, Collaborative, Digging Deep
The next part of the blended lesson is the in-class work, which here will consist of active student participation in a “lab” to get to the root of the importance of the unit circle. Students would work in groups, following a lab procedure that would lead them through activities looking at recognizing and questioning the qualities of the circle. At sporadic points throughout the lab, I might draw the class together to make important points or to give them hints on how to proceed, but their background knowledge should give them the foundation to proceed more or less independently. Finally, at the end, we would come together as a class to review our findings and discuss how this new material will benefit us in the coming unit.
How Will the Lesson Flow?
Using a flipped lesson sequence frees up time to focus on deeping students’ learning in class. By intentionally guiding students’ focus from basic to more advance studies of the circle, my hope is that they will not feel overwhelmed by the unit circle and instead give each aspect of it its due diligence and attention; ultimately, this should pay off in gaining both a general knowledge and a more application-based ability concerning the unit circle.
Why Use the Blended Model for this Lesson?
The goal of this lesson is for students to develop an intuitive understanding of the unit circle in order to be fully prepared to deal with all things trig-related in the following units. The unit circle is hugely important and often not covered in due depth. It may seem that math teachers’ insistence on knowing by heart the values on the unit circle is overboard, but really – they are not deceiving you in telling you that knowing this material like the back of your hand will pay you back several fold as you continue in math. More critical even than memorizing the values of the circle and a much more thorough way of learning the circle, in fact – is being able to derive these values. From what do they stem? How are radians related to measures of a circle? How are trig functions tied to coordinate points? How do we convert between trig functions, or even undo trig functions with inverses? These are the deeper questions that students should be able to answer.
I created a screencast about a very helpful STEM typesetting program called LaTeX. I thought screencasting would be a helpful method for displaying this information because I could show some sample documents of LaTeX code and compare these to the final version in order illustrate how the coding process allows one to create such professional and well-formatted finished products.
I found CaptureSpace to be intuitive and easy to use. I tried using the “draw” function to highlight certain parts of the screen while screencasting, which worked decently, save for slowing the video down a little and requiring extra time to erase the writing on the screen and turn the feature on and off. I wager that this feature would come in handy particularly if I wanted to write math on the screen, for example. I ended up making multiple takes to move more efficiently through my message and found it somewhat inefficient to have to re-record when I made a mistake. However, in the end, I felt like the screencast turned out decently and conveyed the message I wanted.
From here, I envision using screencasting to create mini-tutorials similar to those on Khan academy: as supplements to class instruction or resources for students to explore extensions to material in class. In a math class, rather than interrupting class to use technology, perhaps I would create a screencast to display what I would have in class so I can focus on the central material in class without losing the benefits of using technology as a visual supplement.
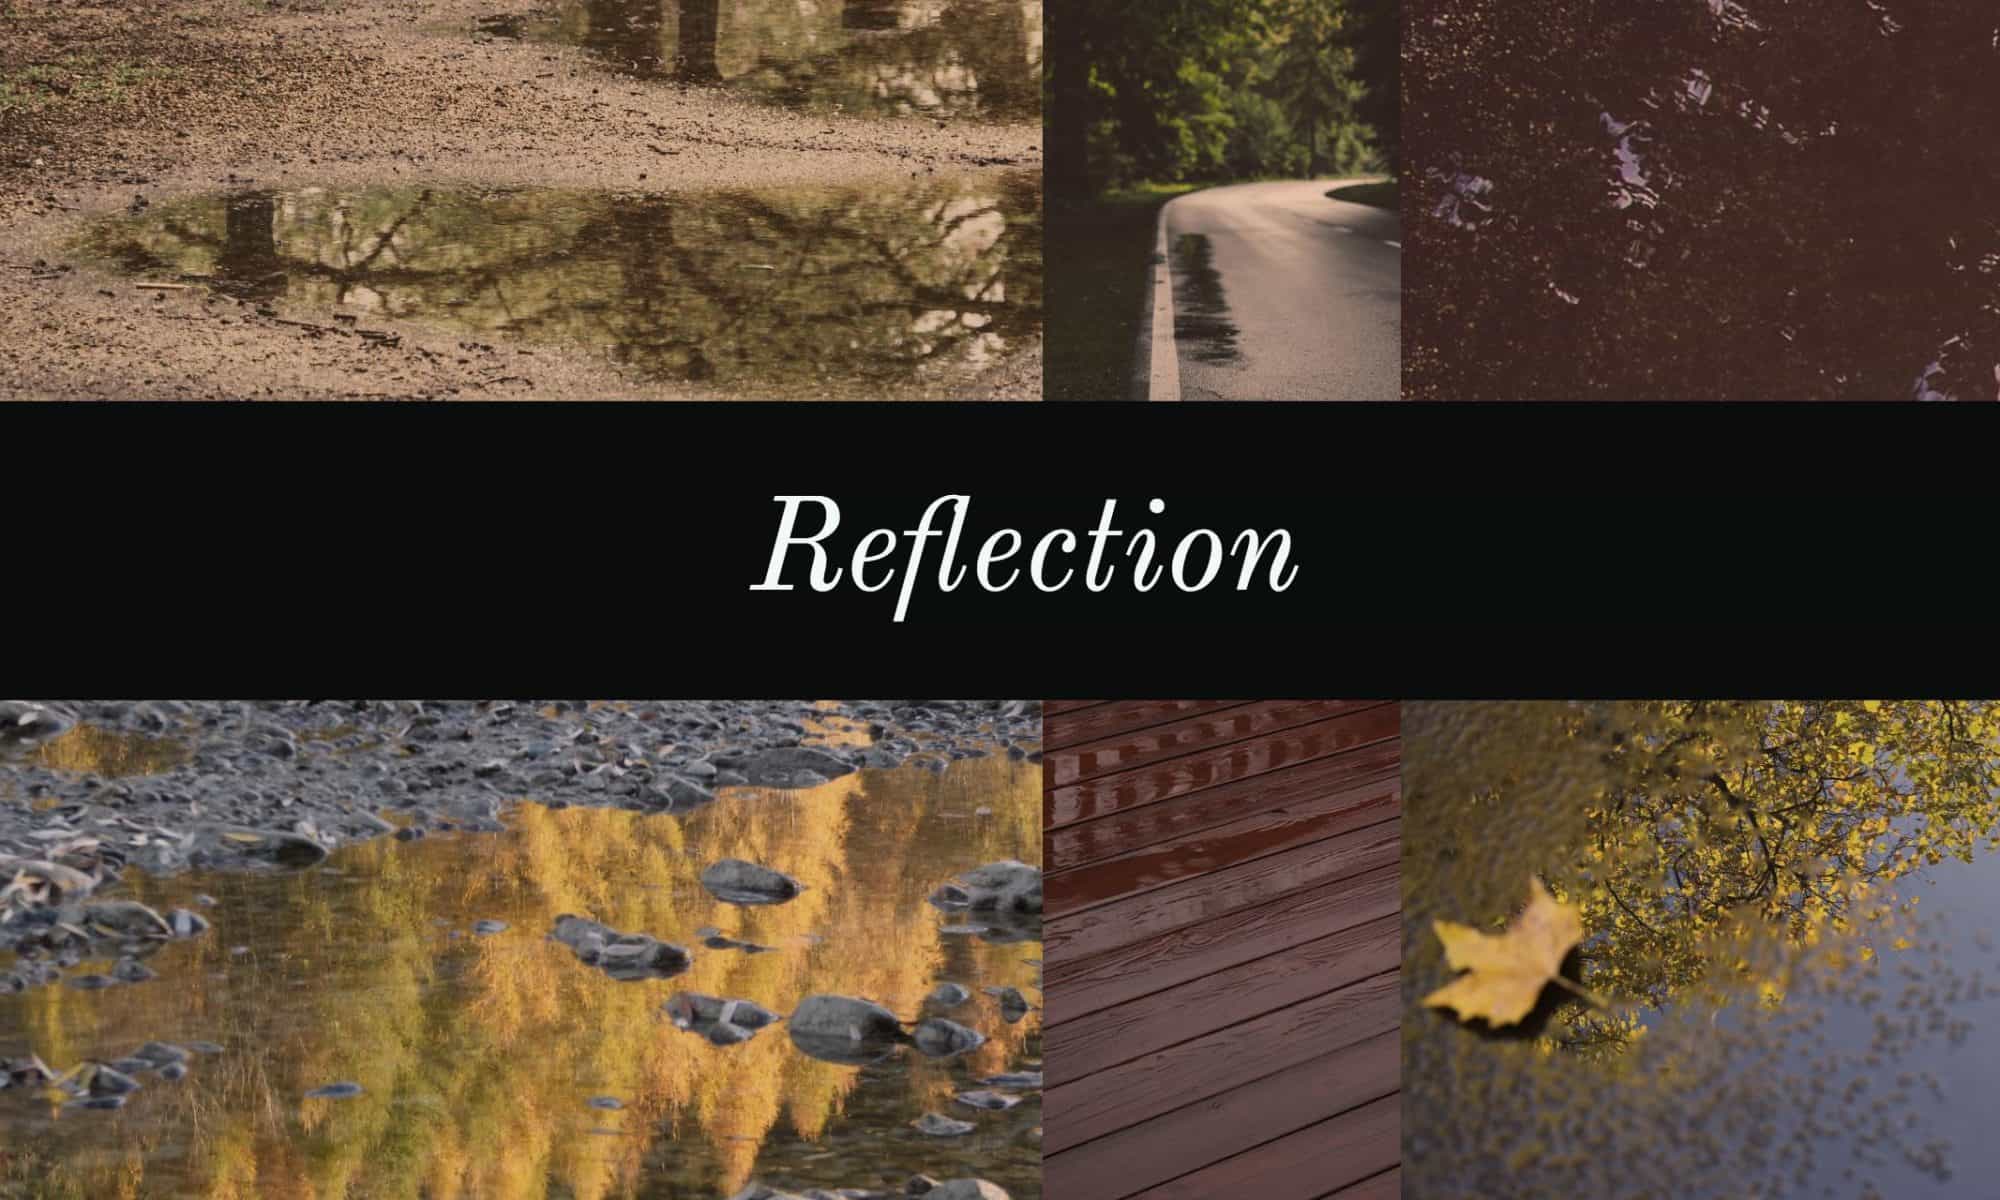
The internet is a jungle – vast, dense, and full of resources. This task challenged me to pick up my hypothetical machete and trek into it, learning how to find needed resources efficiently and then use them fairly.
On this particular trek, I delved into the virtual jungle to find pictures of the actual jungle – or at least pictures of Venezuela to get started on a presentation for a Spanish class I’m taking. I chose Flickr to search for photos, limiting my search to Creative Commons photos. I noticed how many high quality photos disappeared when I added this limiting term, but what could I complain since I could use the material free of charge (with reference and non-commercially)? I further noted that I could limit the search by size, orientation, date, and content, which could make the search process more efficient.
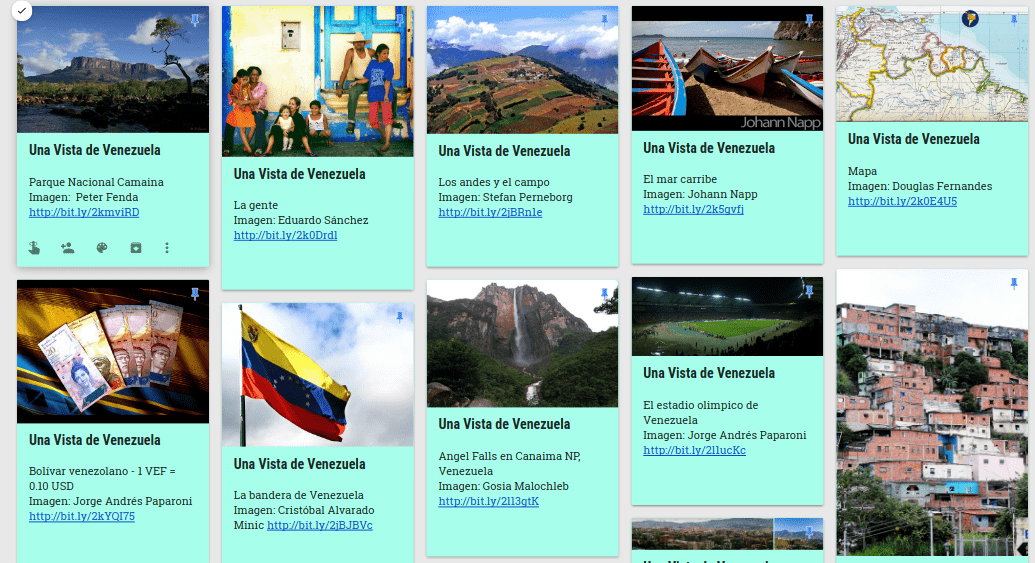
My archive tool of choice was Google Keep, which centers around “notes” that can include a mix of text, content, colors, and links. Once I found my photos of choice, I simply downloaded them, uploaded them to Google Keep and added a short description and photo credit. For fun, I tried using Bitly to shorten the link addresses to the Flickr photos, which was self-explanatory and simple. When all finished, I had a neat collection of photos, ready to use for content creation since I could easily include the image sources.
(My assortment of images and sources on Google Keep)
And that concludes my short foray into the jungle, learning about the mesas of Venezuela, and digital literacy and content curation at the same time.
My placement has notably little technology available, at least compared to those of my peers. Technology includes the teacher’s computer, an Elmo document camera, a projector, and a set of calculators. Yet I cannot imagine needing much more for this level of math – which includes Algebra I and Algebra II.
As a teacher, I use Google Docs to create and store daily warm-ups and exit quizzes, using the projector to display these problems on the front board. This is certainly helpful, not only to allow me to organize, update, and plan for each class, but also to be able to present more graph-oriented or visual problems that would take a deal of time to copy onto the board. Nearly daily, I also use the document camera when I am teaching lessons. I tend to prefer this method since I can face the class as I instruct, rather than writing on a board and then turning to speak. Another benefit of this method is having a written copy of the exact lesson I present that I can later show students who missed something or who were absent previously. Likewise, it allows me to keep a detailed record of how exactly I went about teaching a particular lesson, since this material is not lost once it is erased. Additionally, this year I have frequently used Desmos Online Calculator to create graphs for my Algebra II class and give students the opportunity to visualize shifts in graphs. Finally, I have seen my CT create YouTube videos of abbreviated lessons to support students who are frequently absent, have language barriers, or need to hear an explanation one more time. I view this to be tantamount to the Algebra II class, given that this class does not have a textbook, so students can then rely on something more than just any notes they take in class.
At this level of math, when students are still learning the fundamentals – which admittedly have the propensity to be a bit dry and boxy – basic technology suffices. Students can focus on learning calculator functions for graphs, but otherwise stick to the concrete, straightforward concepts that are usually best solved with pencil and paper. While I have seen teachers use online quizzing platforms for fun class competitions or Smart Boards to record student work on the “white board”, I do not see either of these functions as essential or possible solely through technology.
In this age of the ubiquitous use of technology, it seems odd to dismiss its applicability to the classroom. It can provide new and exciting possibilities for presenting math. Yet I find it hard to implement creative lessons for math while still covering all of the standards in the given time. Thus I find myself using only bare bones technology to support straightforward lessons. I perceive a constant clash between getting lost in the wonderful, creative, exploratory elements of math (which technology could support) and sticking strictly to the schedule of more down to earth, black and white, repetitious elements. The more I think about it, the more it seems that technology use in math should increase as students move past the fundamentals – perhaps in Calculus or even beyond. This math is often more abstract or more applied, both of which can be supported by programs and graphics on technology that do not subtract from students’ focus on the crux of the material. I remain dubious of heavy use of technology in lower levels of math, though. Perhaps, through this course I will open my eyes to new possibilities availed by technology and discover more of a middle road approach to using technology strategically and in a manner that richens learning.